Lecture: 04
CONCEPT OF DEMAND & SUPPLY
Definition of Demand:
It is the quantity of
the good purchased at a given price in a given time.
Explanation:
The
word ‘demand’ is a desire of a buyer to buy. It is a relationship showing
various amounts of a commodity that a buyer would be willing and able to
purchase at alternative prices during a given time period, all other things
remains the same. Thus the definition of demand includes three components;
(a) Price of the commodity
(b) Quantity of the commodity
(c) Time
Note: that time period may vary. This can be week,
month, year etc.
For example:
Muhammad Ali purchased 1 kg of rice at
Rs.25 per kg last week.
This is the demand for rice
by Muhammad Ali.
Law of Demand:
The law of demand is given as, “If price of a commodity falls, its
quantity demanded increases and if price of the commodity rises, its quantity
demanded falls, other things remaining constant.” OR Demand is inversely proportional to Price and Quantity.
Demand Curve:
A
Demand Curve is a graphical representation of the relationship between price
and quantity demanded. It is a line or curve, in which point P is Price and Qd is quantity demanded. That point shows the amount of the good
buyers would choose to buy at that price.
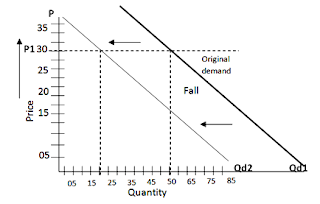
Rise and Fall of Demand (or
Shift in Demand Curve)
When demand for a commodity goes up or down, not due to
price but due to other factors, the change is called rise (or increase) in
demand and fall (or decrease) in demand.
Example:
In Summer, the original demand (sale) of apples remains at 40 kilos
per day with the price of Rs.48 per kilo which increases in Winter
i.e. people buy 100 kilos per day which far ahead of 40 kilos per day
but price remains same. This is called increase in demand as depicted in table above.
Fall in Demand:
When
the demand of commodity decreases not due to price but due to other factors the
change is called fall in demand.
1. Change in
Income.
2. Change in
Population.
3. Change in
Consumer Preferences (Tastes or Liking and Disliking).
4. Prices and
availability of related goods (substitutes and complements).
5. Advertisements
and Publicity.
6. Change in
income distribution.
7. Expectations
of future prices can affect current purchases.
8. Change in
quantity of money.
9. Expenditure.


No comments:
Post a Comment